
Overview
The Intelligence Portal
The Intelligence Portal is your window into how your copilots are performing in the real world. It transforms raw interaction data into actionable insights, allowing you to identify knowledge gaps, track user engagement, and continuously refine your system’s expertise.
The portal is organized into three primary sections, with tabs located in the top-left corner of the page: GPT, Reports, and Data.
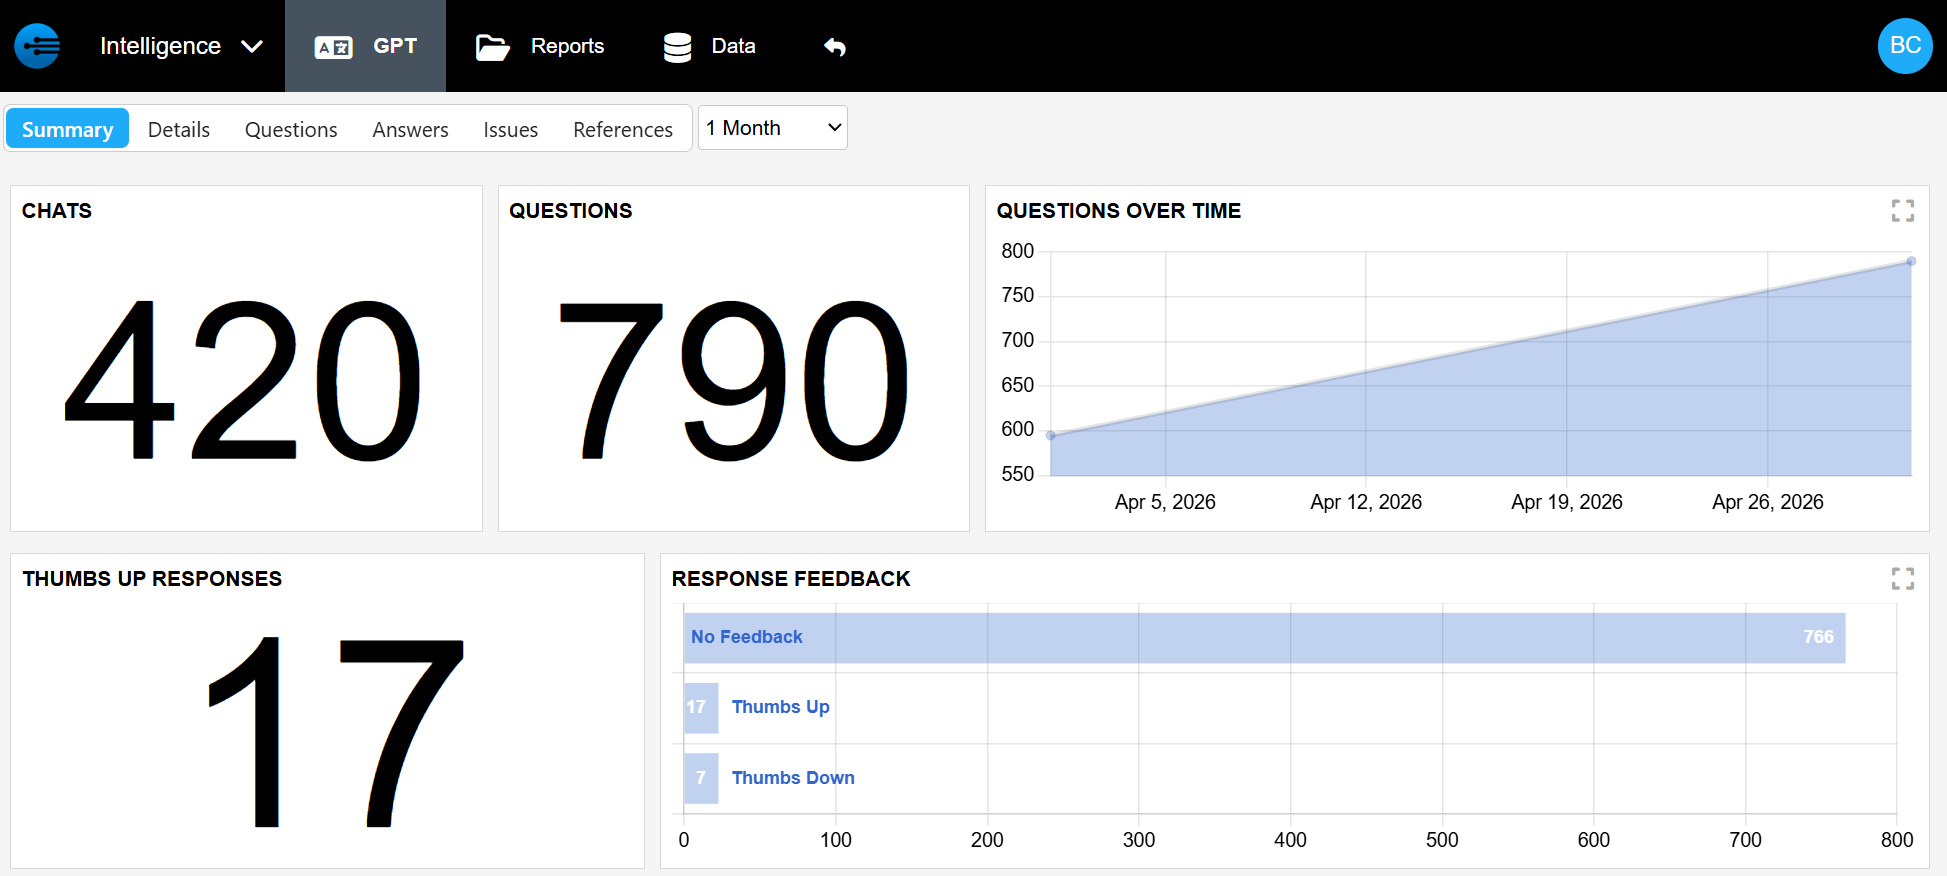
1. GPT: Interaction Analytics
This is the core of the Intelligence Portal, where you can monitor the effectiveness of your AI's conversations. It is broken down into six specialized tabs:
-
Summary: A high-level dashboard that visualizes key metrics, including:
- Volume: Number of chats and questions, including a "Questions Over Time" chart
- User Engagement: Active users over time and chats by role or language
- Quality: Thumbs-up responses and feedback received
- Technical Details: Questions by copilot, references by type, and agent usage
-
Details: A granular breakdown of every individual session, including date, user, question, answer, references used, and feedback provided.
-
Questions: Automatically clusters similar questions together to reveal common user inquiries across copilots and roles.
-
Answers: Clusters similar answers to help authors verify consistency and quality across responses.
-
Issues: A repository for all negative interactions, including thumbs-down responses, flagged content, and "no answer found" cases for admin review.
-
References: Lists every resource in your library along with how often each is used, helping identify the most and least valuable documentation.
2. Reports: Custom Insights
The Reports section allows you to generate tailored analytics beyond the standard dashboard:
- Multi-Dimensional Analysis: Cross-reference data between sessions, resources, and copilots.
- Granular Filters: Segment data by user, customer, product, or specific time periods.
- Strategic Planning: Use reports to justify content updates and demonstrate ROI to stakeholders.
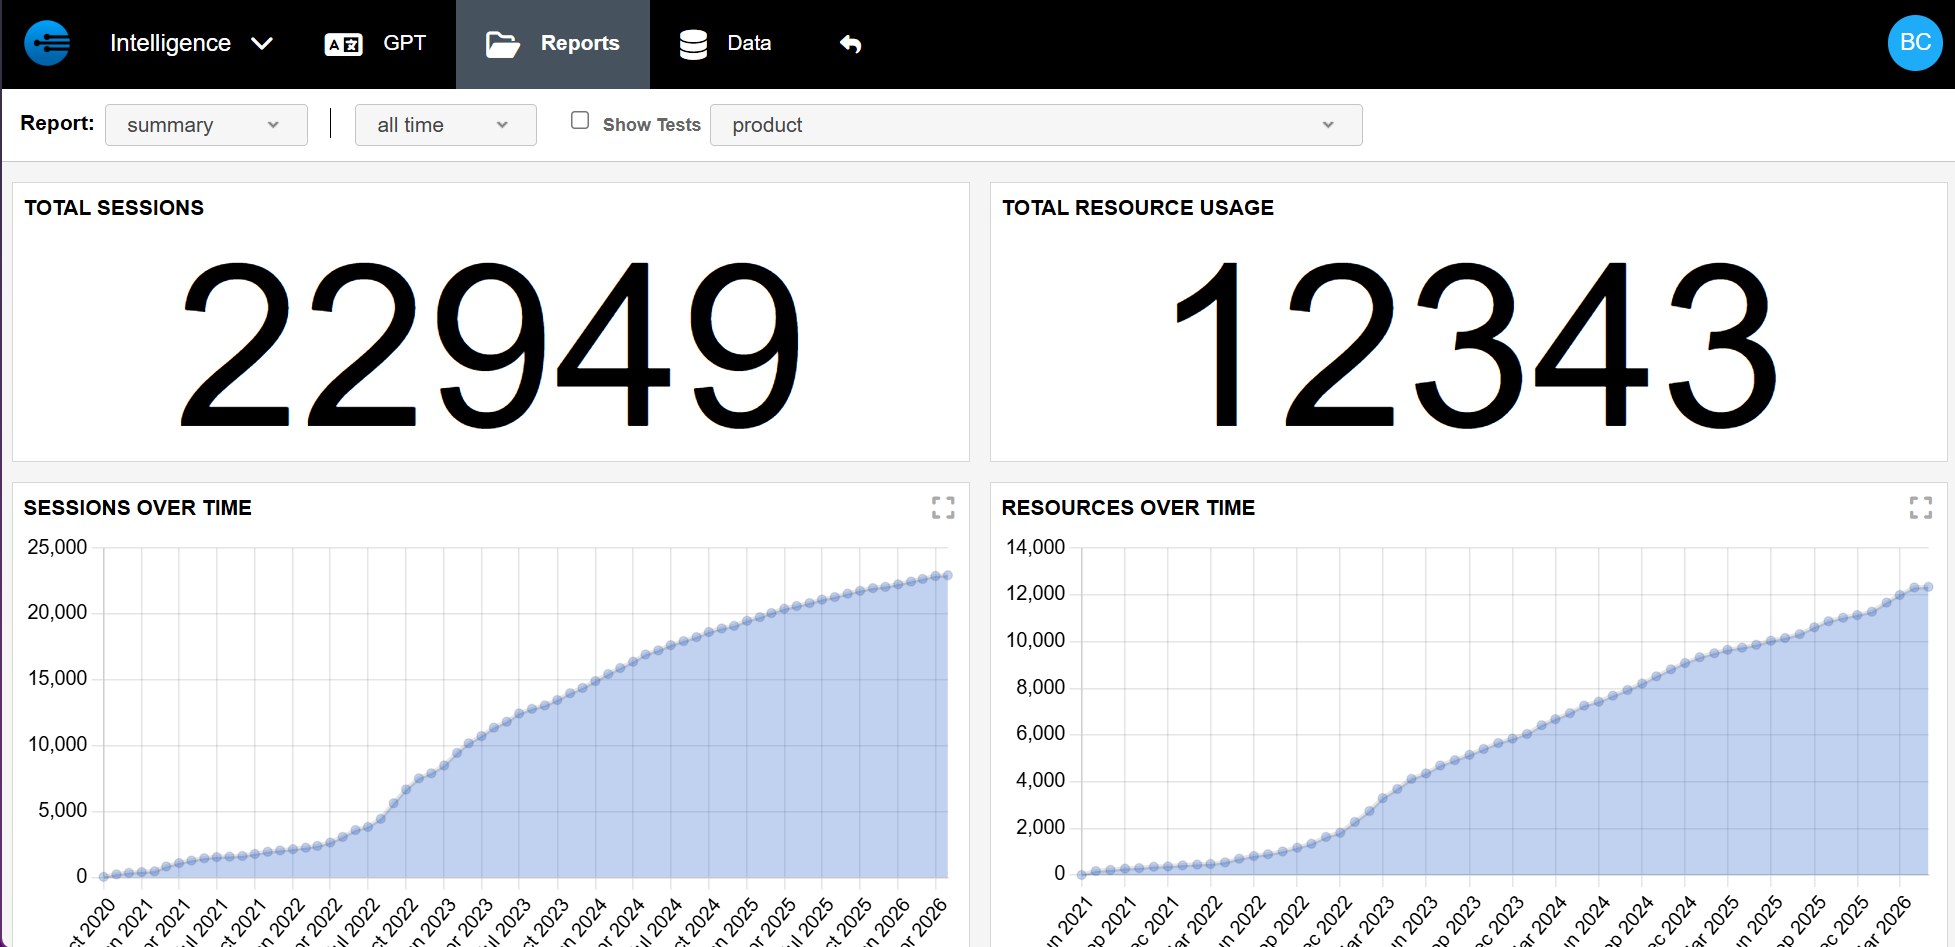
This section provides insights into how users engage with tasks and resources across the platform. It includes metrics such as the total number of task sessions completed, the time period in which they occurred, and their overall effectiveness. In addition to task performance, this section tracks resource utilization with detailed breakdowns by product and time range, offering a comprehensive view of platform usage and user behavior.
The chart below breaks down the specific types of reports included in the summary above, providing additional clarity on the data presented.
| Report Type | Description |
|---|---|
| Total Sessions | Displays the total number of task sessions initiated within the platform. |
| Total Resource Usage | Shows the total number of times resources have been accessed. |
| Sessions Over Time | A trend graph showing how many task sessions have been initiated over time, with a cumulative view of session growth. |
| Resources Over Time | A trend graph illustrating how many resources have been accessed over time, with a cumulative total up to each point. |
| Sessions by Product | Pie chart breaking down task sessions by product copilot, highlighting the top five copilots used. |
| Resources by Product | Pie chart showing resource usage distributed across product copilots, highlighting the top five copilots associated with resource views. |
| Sessions by Status | Color-coded pie chart displaying the status of task sessions, indicating how many were completed, initiated, active or escalated for further support. |
| Sessions Escalated | Pie chart showing how many sessions required escalation to support, representing overall task resolution effectiveness. (True = Escalated | False = Completed Task) |
| Sessions by Solution | Bar chart indicating which solutions successfully resolved sessions, based on the “Finished” outcome selection at the end of a task. |
| Resources by Resource | Identifies the most frequently accessed individual resources within your account. |
3. Data: The Raw Foundation
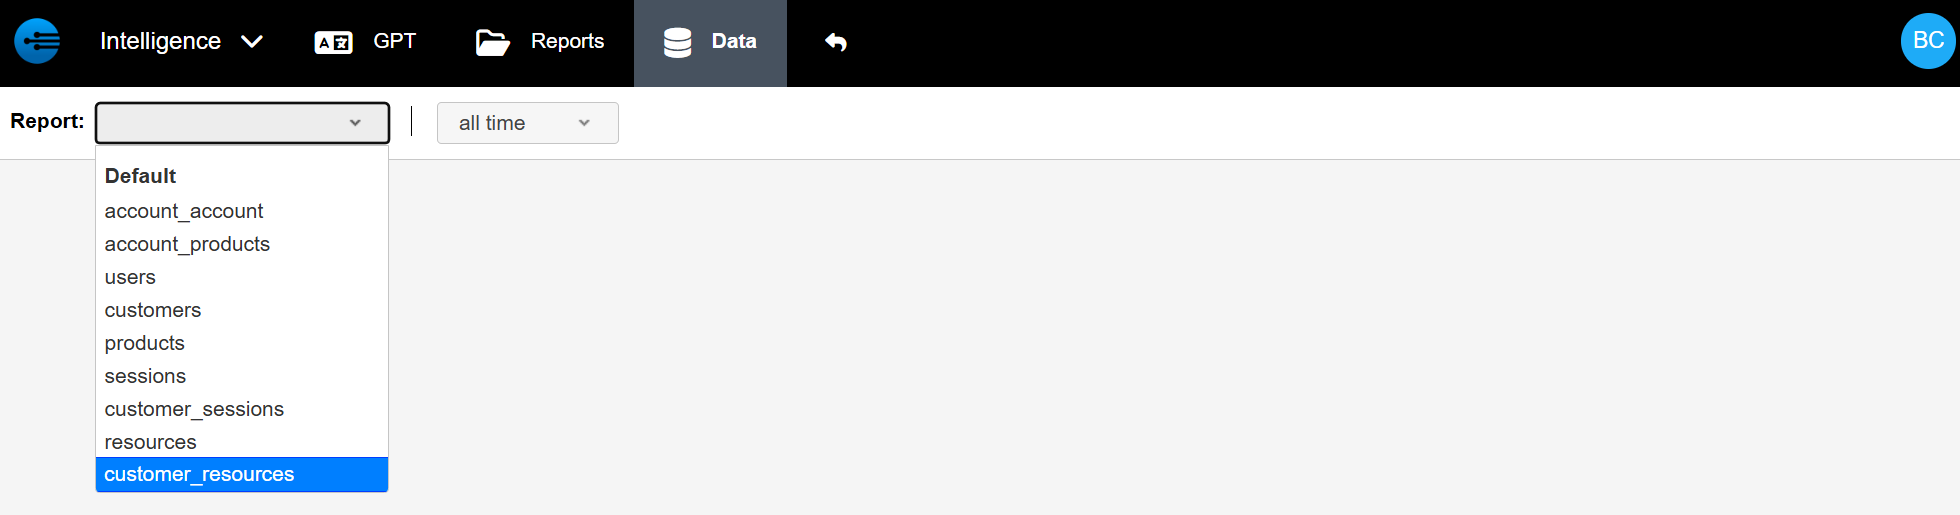
The Data tab provides a more comprehensive look into the performance on your equipment. In contrast to Reports, Data provides information in a spreadsheet. This spreadsheet is modifiable and can look into various aspects such as users, customers, copilots, sessions, customer sessions, resources, customer resources, account, and account copilots. The spreadsheet can also be narrowed down to a specific time frame and can be simplified by selecting which columns you want to be presented.
Updated about 2 months ago